case study, 2026
project Summary
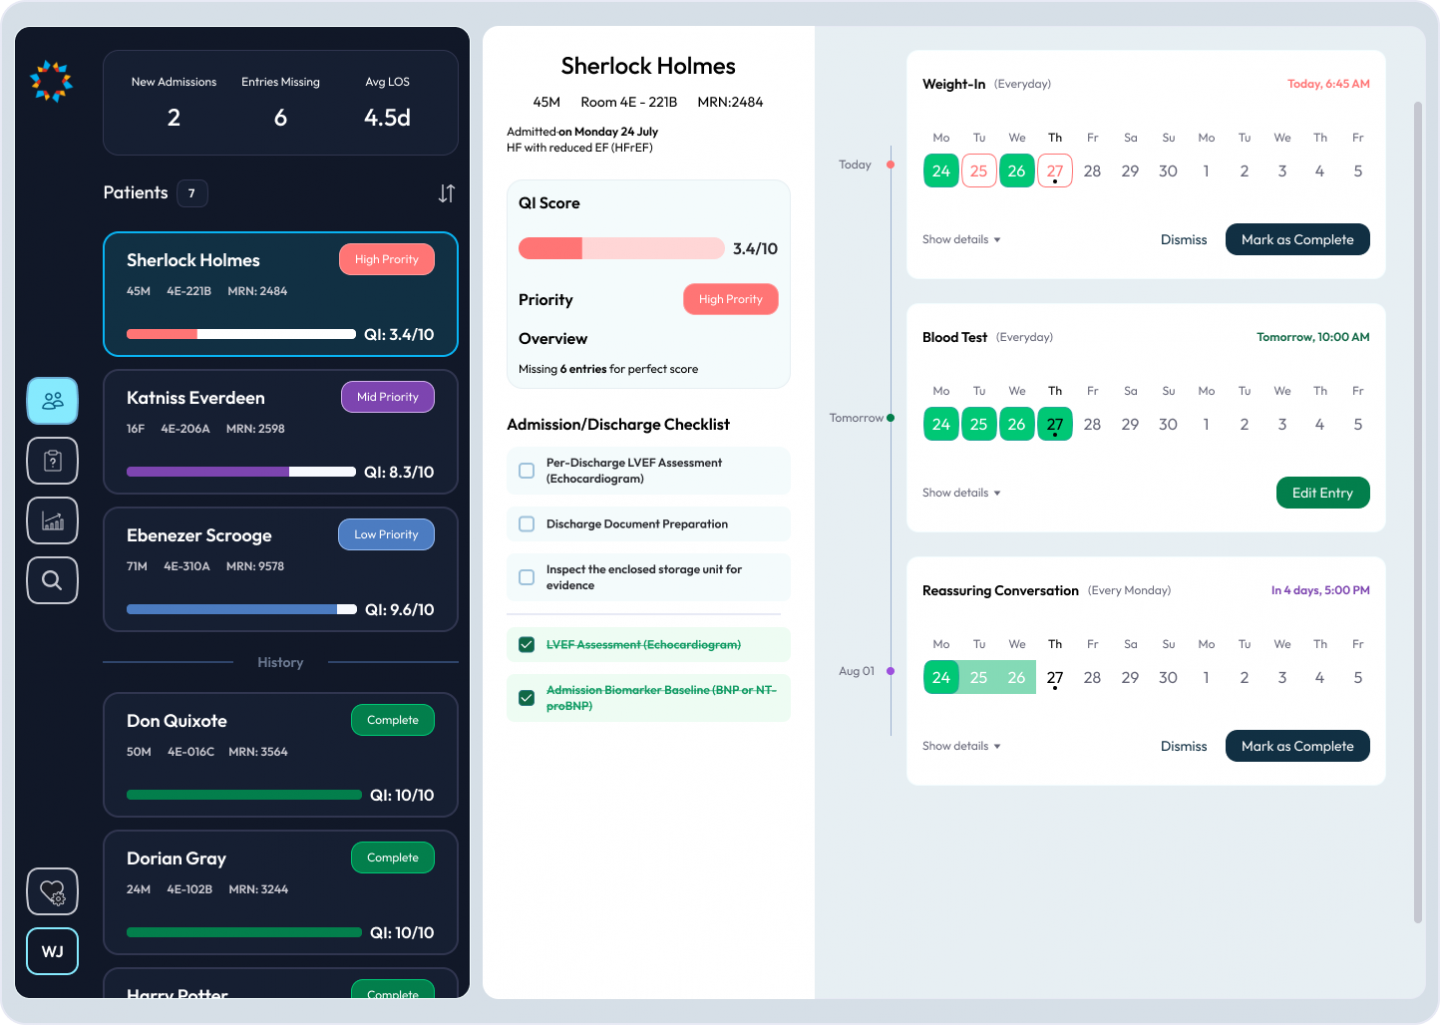
- Physician-side: A Clinical dashboard that provides real-time feedback for physicians, ensuring that every heart failure patient receives the highest quality of care (QI Score) during their hospitalization.
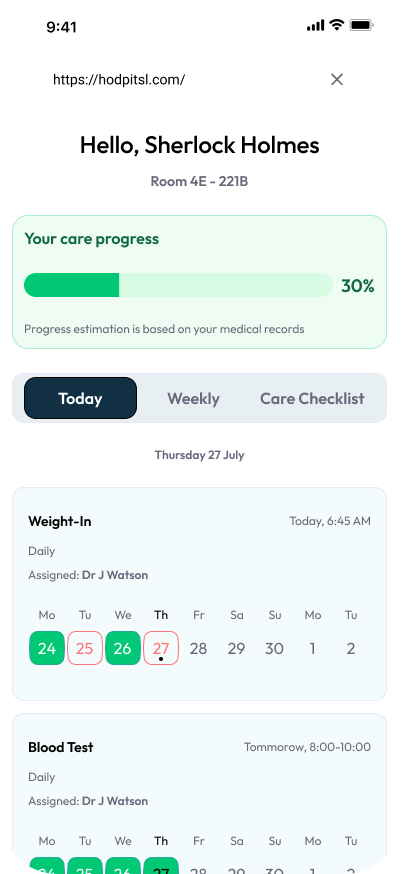
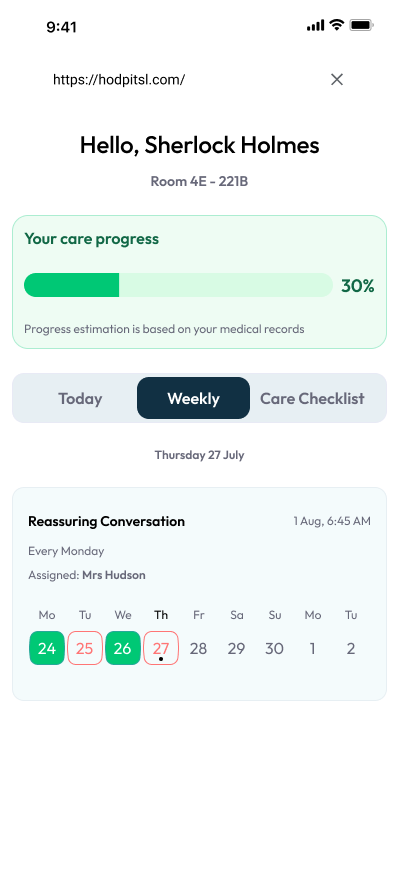
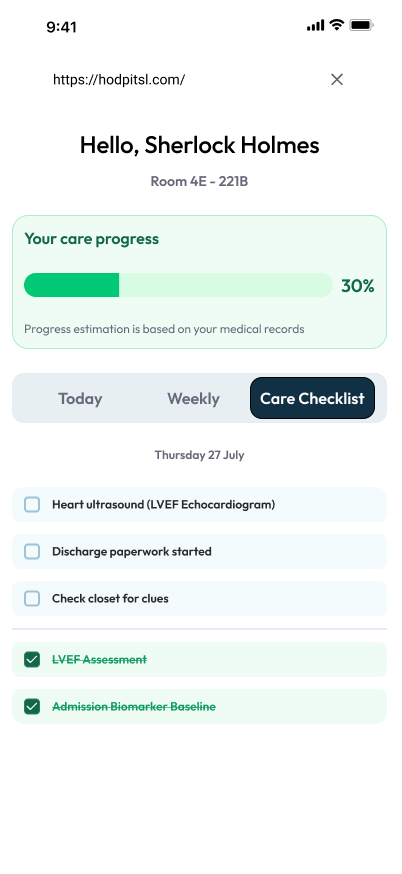
- Patient-side: An adapted web version of the dashboard for patients to see how their treatment is progressing before discharge.
Industry
location
Medtech
Toronto, Ontario, Canada
Physicians-side
By building a rules-based dashboard integrated directly into the EHR, the system continuously checks structured clinical data against the EQUAL-HF framework to determine Quality Indicator (QI) attainment while the patient is still in the hospital.
The Goal
Provide physicians with tangible information on whether the crucial treatment step was missed to prevent premature discharge and lower readmission rates.
Pain Points
Fragmented Clinical Information
Critical data is scattered across the EHR (notes, labs, orders), requiring constant context-switching within systems. This slows down decision-making and increases the risk of oversight.
Missed or Delayed Interventions
Eligible treatments (e.g., medications, diagnostics) are often delayed or missed due to time pressure and lack of real-time visibility.
Cognitive Overload During Rounds
Currently, QIs are checked manually via "chart-mining" - a fragmented process that takes 5–10 minutes per patient - leading to decision fatigue and inconsistent care.
Retrospective Feedback Loops
Current quality monitoring relies on audits after discharge, making it impossible to correct missed care in real time.
problem
Despite robust evidence-based guidelines for Heart Failure (HF) care, hospital physicians often struggle with “information overload.” Critical Quality Indicators (QIs)—such as the timely initiation of GDMT (Guideline-Directed Medical Therapy)—are frequently missed due to fragmented data across EHR systems. Traditional audit-and-feedback happens weeks after discharge, when it is too late to impact the patient’s immediate outcome.
solution
Utilize an LLM to scan clinical documentation, lab results, and medication orders continuously. It measures these against the EQUAL-HF quality indicators (e.g., ACE inhibitor prescription, echocardiogram completion, and discharge education).
Design System
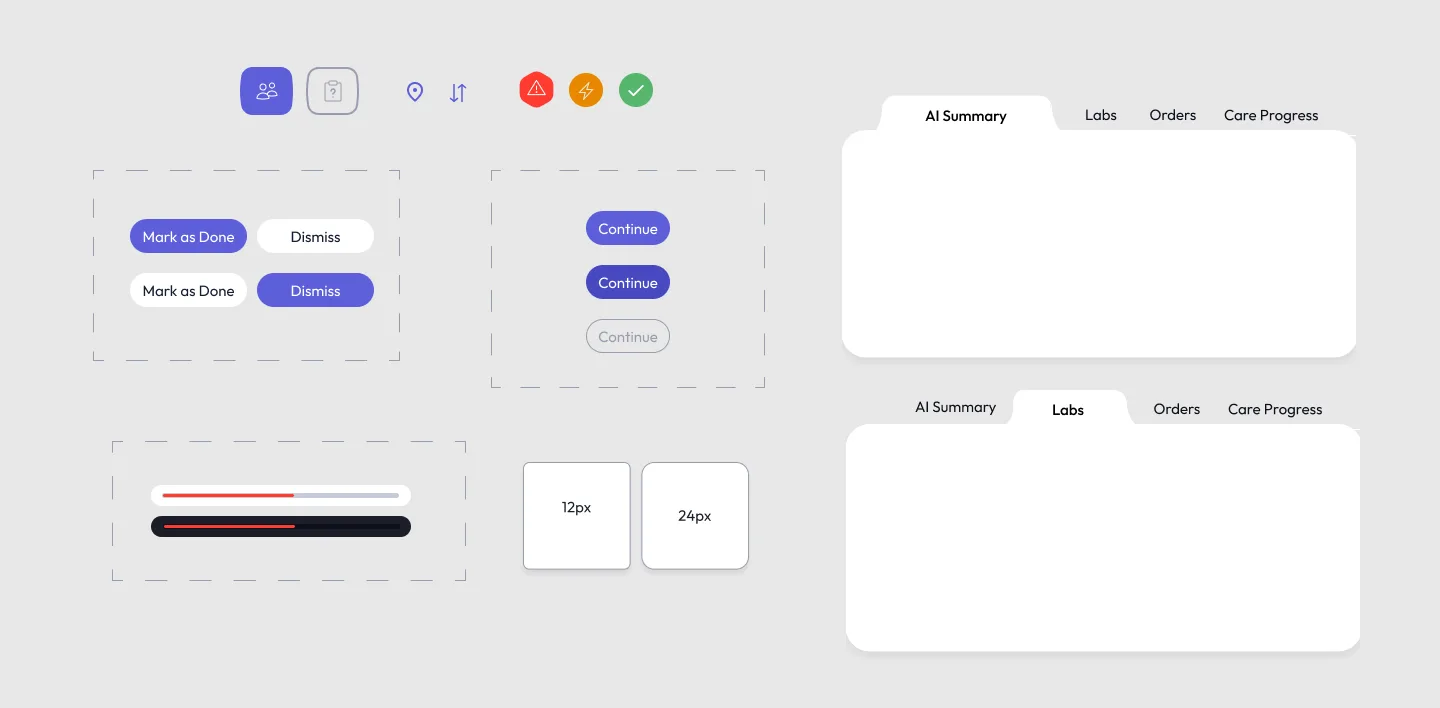
Physician User Experience is: Dense, Fast, Action-driven, clear.
typography
Geometric but soft font that feels “clinical-tech”, but not cold, and has excellent readability and works well in dense data environments (EHR-style UI)

color
I developed a clean, healthcare-appropriate palette that uses blue + accent blue to feel like a modern healthtech AI product and make the alert color system stand out
Primary Brand
HEX: 5D5EDA
Secondary Brand
HEX: 4FD1C5
Neutral White
HEX: E8E8E8
Neutral Black
HEX: 1B1E27
final UI
Patient-side
Reduce Anxiety by providing a clear, predictable roadmap to discharge so the patient knows exactly what needs to happen before they can go home.
final UI
conclution
The success of this feature highlighted the importance of early stakeholder alignment, iterative design, and designing for real-time decision-making in high-stakes environments.
next steps
By focusing on real-time visibility and efficient response actions, we significantly enhanced the effectiveness of the system, making medical teams more proactive and responsive. Lessons learned here will inform future improvements in live monitoring and automation.
Ready to connect?